File:Emissions-by-sector-–-pie-charts.png
(Redirected from File:ghg-pie-chart.png)
Size of this preview: 633 × 599 pixels. Other resolution: 1,302 × 1,233 pixels.
Original file (1,302 × 1,233 pixels, file size: 265 KB, MIME type: image/png)
Summary
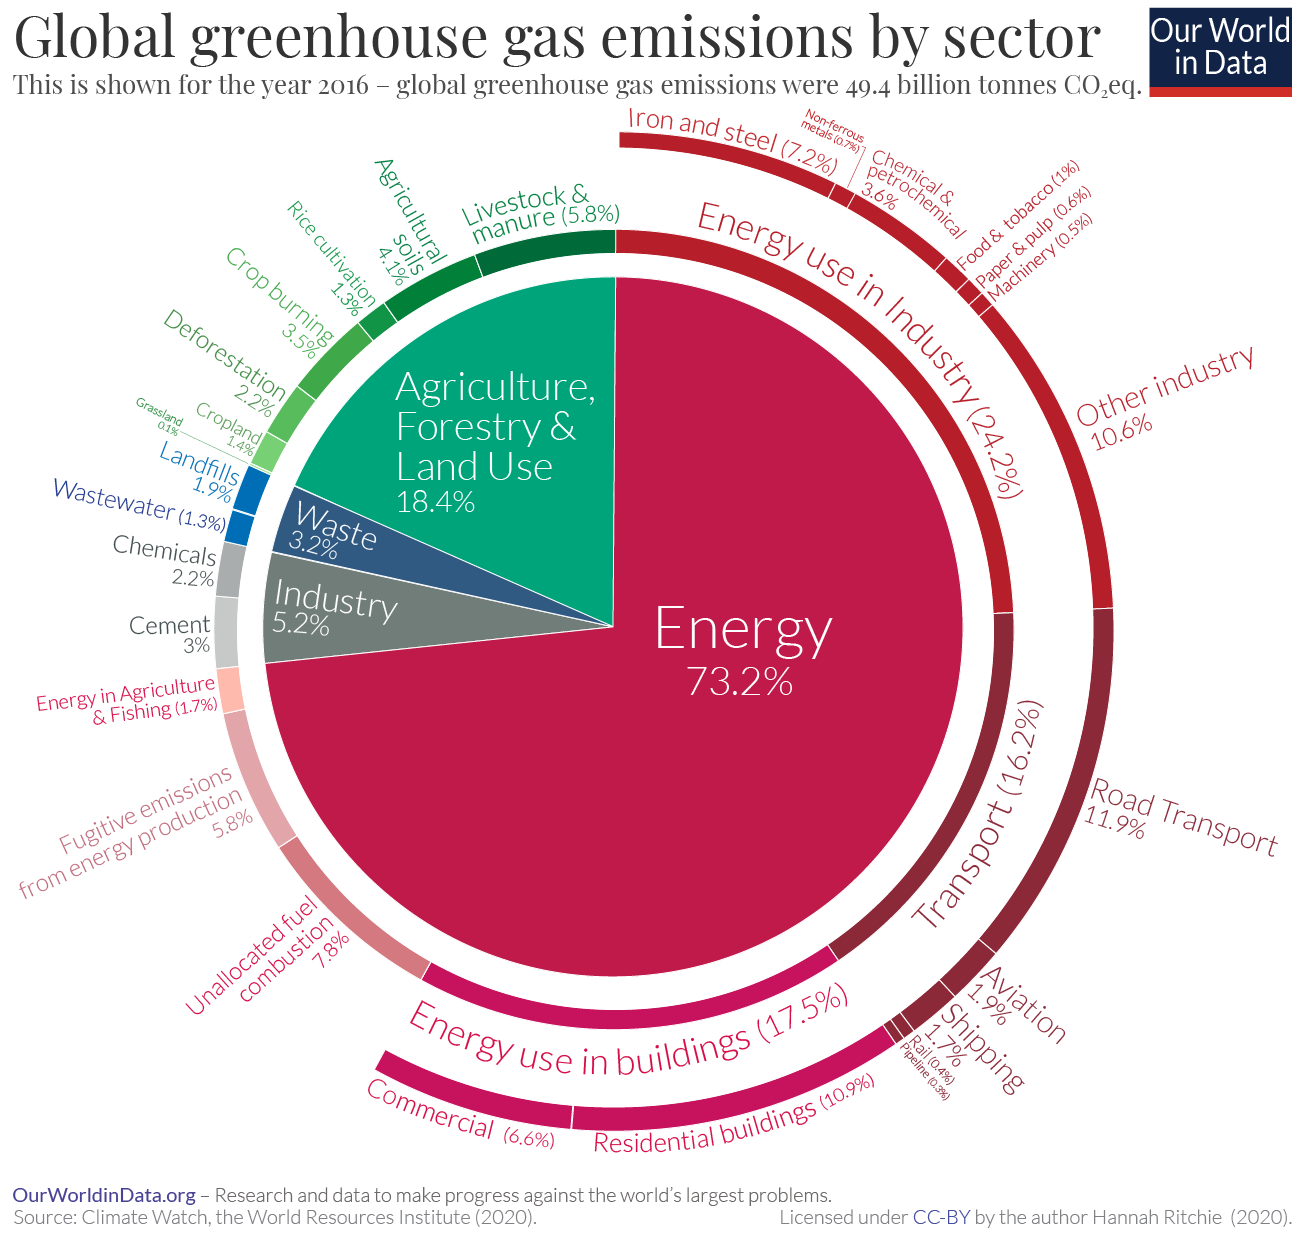
Source: Our World In Data
Pie chart of the world's greenhouse gas emissions, by economic sector. Total: 49.4 billion tonnes CO2eq per year (based on data from the year 2016).
File history
Click on a date/time to view the file as it appeared at that time.
| Date/Time | Thumbnail | Dimensions | User | Comment | |
|---|---|---|---|---|---|
| current | 23:08, 25 July 2023 | | 1,302 × 1,233 (265 KB) | Elie (talk | contribs) | Source: [https://ourworldindata.org/ghg-emissions-by-sector Our World In Data] Pie chart of the world's greenhouse gas emissions, by economic sector. Total: 49.4 billion tonnes CO2eq per year (based on data from the year 2016). |
You cannot overwrite this file.
File usage
The following file is a duplicate of this file (more details):
- File:Emissions-by-sector-–-pie-charts.png from Wikimedia Commons
The following 10 pages use this file:
- Fossil fuels
- Stop climate change
- File:ghg-pie-chart.png (file redirect)
- Archive:000/Climate change
- Archive:000/Draft:Climate change 2
- Archive:000/Electric vehicles
- Archive:000/Personal choices affect climate change
- Archive:000/Why energy usage serves as a good general estimate of carbon emissions
- Archive:002/Climate change