File:ghg-usa-2020.png: Difference between revisions
(Greenhouse gas emissions by type - pie chart of CO2eq - USA Source: [https://www.epa.gov/ghgemissions/overview-greenhouse-gases Overview of Greenhouse Gases - US EPA]) |
|||
| Line 3: | Line 3: | ||
Source: [https://www.epa.gov/ghgemissions/overview-greenhouse-gases Overview of Greenhouse Gases - US EPA] | Source: [https://www.epa.gov/ghgemissions/overview-greenhouse-gases Overview of Greenhouse Gases - US EPA] | ||
Total U.S. Emissions in 2020 = 5,981 Million Metric Tons of CO2 equivalent (excludes land sector). Percentages may not add up to 100% due to independent rounding. | |||
Latest revision as of 17:16, 22 March 2023
Summary
Greenhouse gas emissions by type - pie chart of CO2eq - USA
Source: Overview of Greenhouse Gases - US EPA
Total U.S. Emissions in 2020 = 5,981 Million Metric Tons of CO2 equivalent (excludes land sector). Percentages may not add up to 100% due to independent rounding.
File history
Click on a date/time to view the file as it appeared at that time.
| Date/Time | Thumbnail | Dimensions | User | Comment | |
|---|---|---|---|---|---|
| current | 17:12, 22 March 2023 | 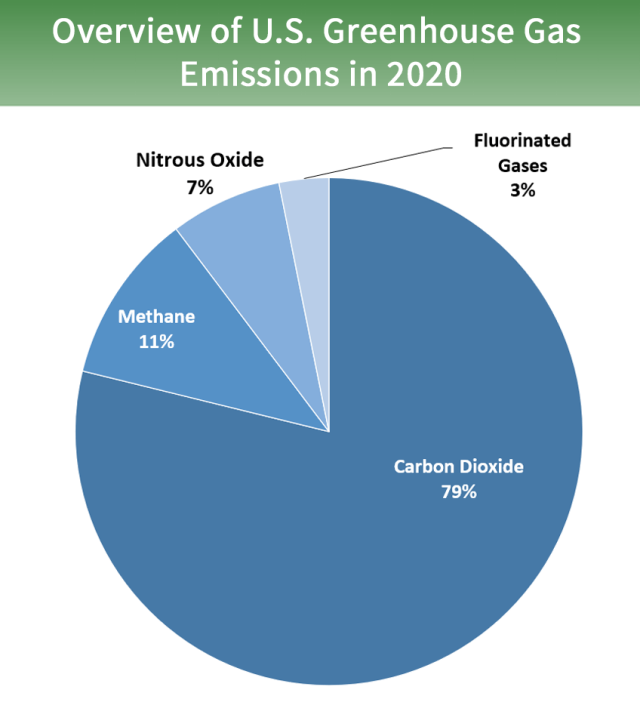 | 640 × 702 (79 KB) | Elie (talk | contribs) | Greenhouse gas emissions by type - pie chart of CO2eq - USA Source: [https://www.epa.gov/ghgemissions/overview-greenhouse-gases Overview of Greenhouse Gases - US EPA] |
You cannot overwrite this file.
File usage
The following page uses this file: