File:land-usage2.png: Difference between revisions
(The 3 main land uses - crop land, pasture land, built-up land - shown in 3 overlapping colors.) |
|||
| Line 1: | Line 1: | ||
== Summary == | == Summary == | ||
The 3 main land uses - crop land, pasture land, built-up land - shown in 3 overlapping colors. | The 3 main land uses - crop land, pasture land, built-up land - shown in 3 overlapping colors. | ||
: Yellowish-orange is crop land. | |||
: Cyanish-blue is pasture land. | |||
: Magenta is built-up land (housing & cities) (which may be hard to see outside of India & China). | |||
These colors act like inks, which when overlap, create mixed colors. | |||
[[Code:isochromic.c|Image generator]] code: | |||
pop << data/population.data-float64-8640x4320 # population counts | |||
crop << data/cropland.data-float32-4320x2160 # cropland fraction of land | |||
past << data/pasture.data-float32-4320x2160 # pasture fraction of land | |||
earth<< data/continents-black-on-white.png # base layer 8640x4320 | |||
# convert the data and shrink down to 4320x2160 | |||
pop @@ quantity_to_density # convert to 'people per km^2' | |||
pop /= 2500 # [[land/built-up|threshold for land to be considered 'fully built-up']] | |||
pop @@ width/2 | |||
pop @@ height/2 | |||
crop >= 0 | |||
past >= 0 | |||
earth *= -0.07 | |||
earth += 1 | |||
earth @@ width/2 | |||
earth @@ height/2 | |||
# make image | |||
out.r := earth | |||
out.r -= past | |||
out.r @@ 01 | |||
out.b := earth | |||
out.b -= crop | |||
out.b @@ 01 | |||
past *= 0.25 | |||
crop *= 0.25 | |||
out.g := earth | |||
out.g -= past | |||
out.g -= crop | |||
out.g -= pop | |||
out.g @@ 01 | |||
out >> data/land-usage2.png | |||
See also: [[:File:land-usage1.png]] | |||
Latest revision as of 03:55, 1 September 2022
Summary
The 3 main land uses - crop land, pasture land, built-up land - shown in 3 overlapping colors.
- Yellowish-orange is crop land.
- Cyanish-blue is pasture land.
- Magenta is built-up land (housing & cities) (which may be hard to see outside of India & China).
These colors act like inks, which when overlap, create mixed colors.
Image generator code:
pop  << data/population.data-float64-8640x4320 # population counts
crop << data/cropland.data-float32-4320x2160   # cropland fraction of land
past << data/pasture.data-float32-4320x2160    # pasture fraction of land
earth<< data/continents-black-on-white.png     # base layer 8640x4320

# convert the data and shrink down to 4320x2160
pop @@ quantity_to_density # convert to 'people per km^2'
pop /= 2500                # threshold for land to be considered 'fully built-up'
pop @@ width/2
pop @@ height/2
crop >= 0
past >= 0
earth *= -0.07
earth += 1
earth @@ width/2
earth @@ height/2

# make image
out.r := earth
out.r -= past
out.r @@ 01
out.b := earth
out.b -= crop
out.b @@ 01
past *= 0.25
crop *= 0.25
out.g := earth
out.g -= past
out.g -= crop
out.g -= pop
out.g @@ 01
out >> data/land-usage2.png
See also: File:land-usage1.png
File history
Click on a date/time to view the file as it appeared at that time.
| Date/Time | Thumbnail | Dimensions | User | Comment | |
|---|---|---|---|---|---|
| current | 03:50, 1 September 2022 | 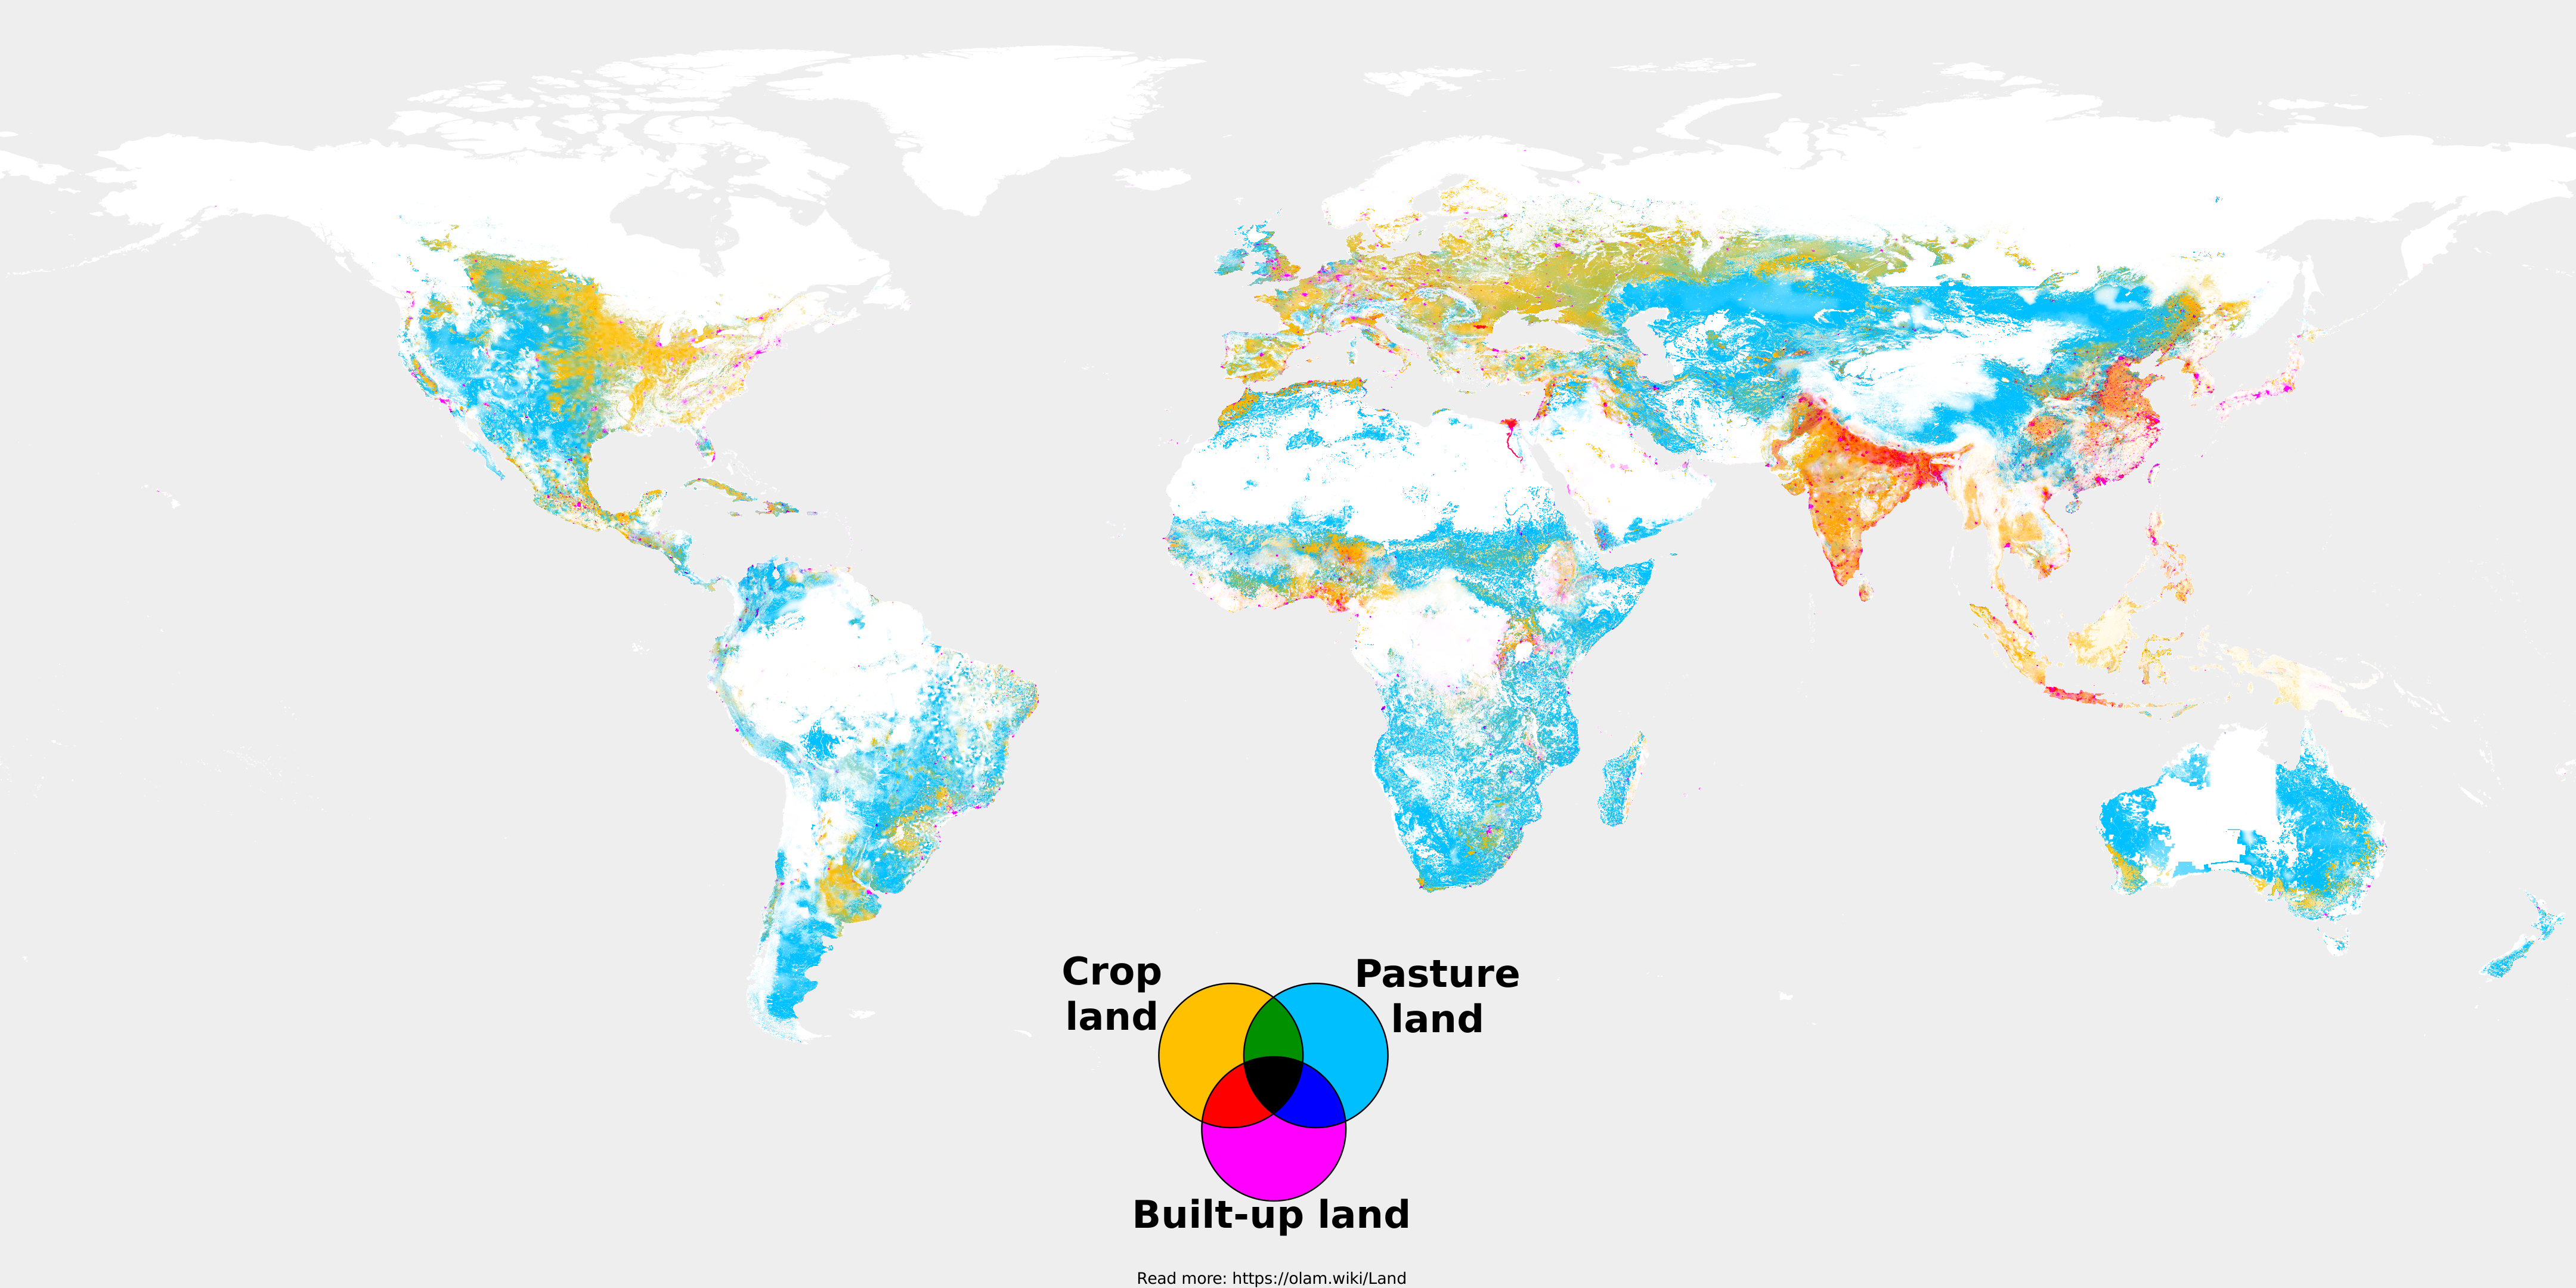 | 4,320 × 2,160 (3.08 MB) | Elie (talk | contribs) | The 3 main land uses - crop land, pasture land, built-up land - shown in 3 overlapping colors. |
You cannot overwrite this file.
File usage
There are no pages that use this file.